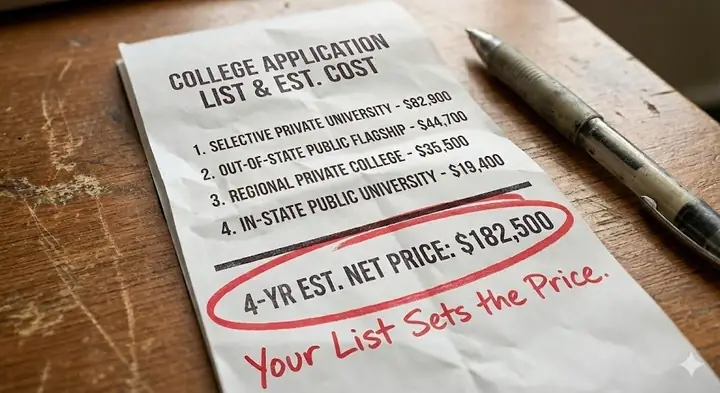
The biggest factor in what families ultimately pay for college isn’t an unpredictable financial-aid formula. It’s the composition of a student’s college list, which can drive wide swings in the final price.
Students with multiple acceptances typically saw a $23,000 annual difference between their least and most expensive options, according to a new Road2College analysis of 7,040 actual offers submitted to its Compare College Offers tool. The offers were made for the 2025 and early 2026 admissions cycles through Nov. 30, 2025.
These differences in families’ net college prices weren’t random. They closely tracked the types of colleges to which students applied. Lists that combined public and private institutions, selective and less selective colleges, or in-state and out-of-state options produced the widest swings in net price. Families who applied only to public institutions or only to private colleges saw much narrower variations.

“Families have the best outcomes when they consider affordability from the start,” says Luanne Lee, a Certified College Planning Specialist with Your College Planning Coach. “Academic fit matters, but financial fit matters just as much. A college isn’t really a dream school if the price puts it out of reach, and the good news is that excellent options exist across many price ranges.”
To understand the price landscape families are navigating, it helps to look first at the median net prices across broad categories of institutions.
Median Net Prices Across Major College Types (2025 Offers)
Net price = cost of attendance minus all grants and scholarships. Medians based on data from Compare College Offers and Road2College Insights.| Category | Median Net Price | Notes |
|---|---|---|
| Public Universities (overall) | $27,300 | Mix of in-state and out-of-state offers |
| In-State Public Universities | $26,555 | Most consistent affordability anchor |
| Out-of-State Public Universities | $44,718 | Often similar to or higher than private-college prices |
| Private Colleges (overall) | $68,860 | Wide range; selective privates at the high end, and less selective privates can be far lower with strong merit aid |
| Overall Median (All Offers) | $44,360 | Reflects the combined mix of publics and privates |
| Sources: Road2College’s Compare College Offers and Road2College Insights. |
||
Typical Net-Price Swing for Students With Multiple Offers
Metric Value Notes
Typical net-price swing ~$23,000 Many students saw $40k–$60k ranges
Sources: Road2College’s Compare College Offers and Road2College Insights.
These medians set the stage for the wide spreads many families encounter. A student applying to both in-state publics and selective private colleges is stepping into a pricing system in which the typical low and high ends differ by tens of thousands of dollars.
To make these broad patterns more concrete, the table below shows median net prices and median merit aid for 20 colleges, each with at least 25 offers submitted to Compare College Offers for 2025.
Median Net Prices at 20 Selected Colleges (2025)
Net price = cost of attendance minus all grants and scholarships. Merit aid = institutional non-need-based grants.| Institution | Type / Category | Sample Size | Median Net Price | Median Merit Aid |
|---|---|---|---|---|
| Purdue University | In-state public anchor (Midwest) | 38 | $20,398 | $0 |
| James Madison University | In-state public anchor (Mid-Atlantic) | 25 | $21,752 | $0 |
| University of Georgia | In-state public anchor (South) | 25 | $22,038 | $19,975 |
| West Virginia University | In-state public, regional flagship | 28 | $23,082 | $14,000 |
| University of Wisconsin–Madison | In-state public anchor (Upper Midwest) | 35 | $25,866 | $0 |
| University of Delaware | Public flagship (OOS-heavy) | 68 | $30,499 | $13,000 |
| University of Colorado Boulder | Public flagship (West, OOS interest) | 49 | $30,998 | $4,000 |
| University of Vermont | Public flagship (New England) | 65 | $30,954 | $20,000 |
| Penn State University Park | Public flagship (Mid-Atlantic) | 44 | $34,542 | $0 |
| University of Pittsburgh | Public research, mixed IS/OOS | 86 | $34,158 | $5,000 |
| Clark University | Private college with high median merit (NE) | 29 | $67,350 | $32,000 |
| Loyola University Chicago | Private college with high median merit (MW) | 44 | $68,364 | $31,000 |
| Seton Hall University | Private college with high median merit (NJ) | 36 | $67,360 | $22,000 |
| Marquette University | Private college with high median merit (MW) | 36 | $64,150 | $29,500 |
| University of Hartford | Private college with high median merit (NE) | 29 | $59,756 | $34,000 |
| Fordham University | Highly selective private (NY) | 62 | $89,758 | $30,000 |
| The George Washington University | Highly selective private (DC) | 26 | $86,100 | $15,000 |
| Northeastern University | Highly selective private (NE) | 51 | $83,880 | $16,000 |
| Case Western Reserve University | Highly selective private (MW) | 51 | $83,502 | $17,000 |
| Drexel University | Selective private (Mid-Atlantic) | 43 | $77,043 | $15,500 |
| Sources: Road2College’s Compare College Offers and Road2College Insights. (All values computed on 2025 offers only, with net price cleaned to 0–$100k.) | ||||
The in-state public examples at the top of the table typically fall in the low- to mid-$20,000s. Out-of-state flagships and nationally known public research universities often land in the low- to mid-$30,000s.
Several private colleges on the list offer substantial merit aid, often $20,000 to $30,000 a year, yet still leave families with median net prices in the $60,000 to $70,000 range. At the very top, selective private institutions such as Fordham, Northeastern, and Case Western Reserve show median net prices in the high $70,000s to high $80,000s for this sample of families.
College List Choices Predict the Net Price Range
The patterns reflected in these tables appeared repeatedly in the 2025 offers. Students who applied only to public universities typically saw modest differences in net price. Students who applied only to private colleges saw similarly contained swings.
But once a list included institutions with sharply different pricing behavior — such as selective private universities, regional public universities, and out-of-state flagships — the range widened dramatically.
A list anchored by in-state publics and merit-forward private colleges creates a different financial picture than a list dominated by selective private institutions. The mix of school types determines the price terrain long before the first offer arrives.
Why Selective Colleges Often Produce the Highest Net Prices
One of the most consistent patterns in the Road2College dataset involved college selectivity. Families often assume that the most selective colleges will also be the most generous, especially given their high-profile commitments to meeting financial need.
However, for middle- and upper-middle-income families, who constitute a large share of Road2College users, selective colleges were often the most expensive options.
Private colleges with admit rates below 20 percent rarely use merit aid to recruit students. Instead, they rely primarily on need-based aid. That approach can be generous for lower-income families but offers limited discounts for many families in the Road2College dataset.
As a result, selective colleges often anchored the top of students’ price ranges, with median net prices in the $80,000s at institutions such as Boston College, Georgetown, NYU, and Fordham.
By contrast, colleges admitting 40 to 60 percent of applicants tended to blend need-based grants with more substantial merit awards, pulling median net prices into the $40,000s. Less selective, merit-friendly private colleges, which compete for strong applicants, often offer enough merit to bring net prices into the mid-$30,000s.
These differences explain why students comparing selective and nonselective private colleges frequently saw large swings between their least and most expensive options.
Median Net Prices by Selectivity Tier
The relationship between selectivity and net price emerged clearly across thousands of 2025 offers. Colleges with lower admit rates, those admitting fewer than 20 percent of applicants, produced the highest median net prices in the dataset, often exceeding $80,000. These institutions rarely use merit aid to recruit students, and many families do not qualify for substantial need-based aid.
As admit rates rise, median net prices fall in a steep, predictable pattern. Colleges in the 20-to-40-percent admit-rate range still delivered high net prices, though slightly lower than the most selective schools. Institutions admitting 40 to 60 percent of applicants exhibited a much wider range of affordability because they combined need-based grants with more substantial merit aid. Broad-access colleges admitting more than 60 percent of applicants produced the lowest median net prices, often in the mid-$30,000s.
Median Net Price by Selectivity Tier (2025 Offers)
Net price = cost of attendance minus all grants and scholarships.| Admit Rate (Selectivity Tier) | Median Net Price | Offer Count |
|---|---|---|
| <20% (most selective) | $82,908 | 509 |
| 20–40% | $70,970 | 828 |
| 40–60% | $61,052 | 1,292 |
| 60%+ (broad admission) | $40,069 | 3,724 |
| Sources: Road2College’s Compare College Offers and Road2College Insights. | ||
This structure helps explain why some students see such large swings in their college costs. A list that mixes selective private colleges with broad-access institutions or merit-forward private colleges will almost inevitably produce a wide range of net prices. In contrast, a list composed primarily of selective private colleges tends to produce consistently high prices with little variation.
Out-of-State Public University Costs Resemble Private Colleges
Out-of-state public universities showed a similar pattern at the high end. Families often assume public institutions are more affordable, but residency plays a far larger role than sector.
Across the dataset, median net prices for out-of-state public universities were typically in the mid-$40,000s, close to the median cost families reported for many private colleges. The University of Delaware, one of the most frequently reported institutions in the dataset, had a median net price above $30,000 for 2025. The University of Pittsburgh, another high-volume institution, showed median net prices in the mid-$30,000s across a mix of in-state and out-of-state submissions.
These schools tend to offer limited merit-based discounts to nonresidents, placing them near the top of families’ price ranges.
Where the Most Affordable College Offers Come From
The most affordable options in students’ price ranges typically came from a different group of institutions. In-state public universities, such as the University of Florida, Florida State, and Iowa State, showed median net prices under $20,000. Regional public universities in the South and Midwest often fell along similar lines.
Strong applicants also saw competitive net prices from merit-forward private colleges and from public and private institutions offering honors programs. At these schools, merit awards were large enough to bring net prices well below many other offers a student might receive, even at well-known institutions.
For families worried about affordability, these schools acted as the financial anchors that helped offset higher-cost acceptances elsewhere.
How to Improve Your College List Before Regular Decision
Because most Regular Decision deadlines arrive in January and February, families still have time to rebalance their college lists with affordability in mind. Adding an in-state public university or a merit-forward college where the student is well above the academic midpoint can provide a more predictable, lower-cost option.
Families considering out-of-state public universities may also want to revisit those choices with full awareness of their likely net prices. In many cases, these institutions cost as much as or more than private colleges.
The Road2College Insights tool can help families compare merit models, residency pricing, selectivity, and cost structures across institutions. It offers free and premium versions. Once offers arrive, families can use the free Compare College Offers to benchmark aid packages against other real student submissions. The two tools share a common login.
Adjusting Your College List for Affordability
College prices can feel difficult to predict, especially as early offers begin to arrive. But this analysis of 7,040 real offers suggests a simpler truth: The differences in what families are asked to pay are shaped months earlier, when the student builds the application list.
Mixing in-state publics, merit-forward private colleges, and a realistic number of reach schools gives families a wider and more affordable set of choices. A list dominated by selective private institutions and out-of-state public flagships tends to produce the opposite.
Because the admissions cycle is still underway, families have time to make adjustments that can expand their financial options before the final offers arrive.
> RELATED:
Road2College’s Analysis Methodology
This analysis is based on real financial-aid offers that families submitted to Road2College’s Compare College Offers tool. Families use the tool to compare their awards with anonymized offers from other students admitted to the same colleges.
For this article, we included every offer uploaded for the 2025 admissions cycle, along with early offers received for 2026 through Nov. 30, 2025. In total, the raw dataset contained 7,081 offers from these two years.
To ensure accuracy, we calculated each student’s net price as the college’s cost of attendance minus all grants and scholarships, including institutional need-based aid, merit aid, Pell grants, state grants, and private scholarships. Offers that produced impossible net prices (less than $0 or greater than $100,000) were removed. This cleaning step eliminated 41 offers, leaving 7,040 valid offers for analysis. Of these, 6,354 were from 2025, and 686 were early offers from 2026.
We matched each uploaded offer to its corresponding college in Road2College Insights, which aggregates data colleges report through the Common Data Set, IPEDS, Peterson’s, and institutional websites. More than nine in ten offers matched successfully to a college in Insights. This allowed us to mark each institution as public or private, estimate whether a student was paying in-state or out-of-state tuition at public universities, and group colleges by selectivity based on admission rates.
Although not every family uploads every offer they receive — and some awards may be revised after financial-aid appeals — the size of the dataset and the consistency of patterns across thousands of offers allow us to draw meaningful insights about how different types of colleges price themselves and why students often see large differences in what they are asked to pay.
_______
Use R2C Insights to help find merit aid and schools that fit the criteria most important to your student. You’ll not only save precious time, but your student will avoid the heartache of applying to schools they aren’t likely to get into or can’t afford to attend.
 Looking for expert help on the road to college? See our 1-1 Coaching Services.
Other Articles You Might Like:
Advice on Selecting a College from a Former Dean of Admissions
10 Reasons to Consider Smaller Schools with Higher Acceptance Rates
The Rise of Direct Admissions: A New Era of College Access
JOIN ONE OF OUR FACEBOOK GROUPS & CONNECT WITH OTHER PARENTS:
HOW TO FIND MERIT SCHOLARSHIPS